I have a static library file (libstatic.a) compiled from C language. Now I want to use some function in this library. But I don't know how to link this file using xrun. It seems that -sv_lib can only use shared library(dynamic lib, .so file), but not static library. Could someone tell me how to use this .a file using xrun? Thanks a lot!
↧
How to link static library(.a) use xrun?
↧
Regular expression for keeping
I have registers defined in vr_ad (with reg_def and reg_fld) and I have a macro that makes me possible to make writes to it, even to fields, e.g.:
wr_reg REG1 keeping {.fld1== val1}
I would like to have an expression that I can use inside the {} with which I could write the same value (e.g. 0) to all the fields of the register, something similar as the "for each" in case of a list. The problem is that I cannot use "for each" in this case as it is not a list but a register with several values. Could you please help me what the regular expression that I could use here is, to have all fields the same value?
↧
↧
Passing variables between structs and sequences
Hi all,
I'm Trying to create an effective "end of test" condition where I generate packets in a designed unit and send them to a sequence.
I'm interested that after a X amount of packets the sequence will end. The problem is that the "number of packets" generated in the designed block is defined there and I'm not sure what is best way to make it visible to my sequence so I could have the "end of test" condition.
Important to mention that I'm working on a big based environment and I'm trying not to make to much changes.
Thank you for your help,
Nir
↧
Using the objection mechanism
Hi all,
I'm trying to use the objection mechanism to coordinate between different sequences.
Initially I used "TEST_DONE" but I saw that when the counter reach 0 it automatically start "end of test" which I would like to control my self.
To solve that I'm interested of extending a new kind of objection and for some reason I cant compile the file.
I've added the next code:
extend any_unit {
extend objection_kind: [NEW_KIND];
};
Can you direct me why my extension doesn't work? i tried also extending sys but then some of the units cant identify the new objection kind.
(I'm using e language)
Best regards,
Nir
↧
xrun cannot initialize values
Context: a digital design, with memory elements
Goal: run power simulations with Voltus
Conditions: need to run the behavioral simulations using systemverilog testbenches where it is really important to initialize the values of all elements, aiming to avoid undefined values in the signals, in the post-simulation exported VCD waveforms. For that I used the xcelium simulator's command -xminitialize
the list of nets, registers, flipflops and memories initialized and the value exactly is done with the option below, and it worked
However the nets are not initialized, check the screenshot Post
/resized-image/__size/1280x960/__key/communityserver-discussions-components-files/30/gtkwave.png
p.s. the full simulation is invoked by a command of this structure
-----
xrun -stats -ieee1364 -errtcl_verbose -access r -timescale 1ps/1ps -top tb_full -v200x -64bit -ALLOWREDEFINITION -gui VHDL/file1.vhd VHDL/file2.vhd Verilog/file1.sv Verilog/file2.v -linedebug -sv -xminitialize rand:4 -xminit_log init_list.log tb_file1.sv
------
thank you on any advice on how to run this correctly
↧
↧
Why xrun timescale does not comply with SV-2012 spec?
In SystemVerilog 1800-2012 spec Section 3.14.2.3, there is below content:
" The time unit of the compilation-unit scope can only be set by a timeunit declaration, not a `timescale directive. If it is not specified, then the default time unit shall be used. "
But I run a simulation with xrun and find that `timescale effect timescale of compilation-unit scope. Please check below code:
----------------------------------------------------------------------------------
`timescale 1ns/10ps
class trans;
task add_delay;
$printtimescale;
$display("%t: add_delay begin",$realtime);
#2.123;
$display("%t: add_delay end",$realtime);
endtask
endclass
`timescale 1ps/1ps
module tb_top;
trans tr;
initial begin
tr = new;
$timeformat(-9,3, " ns", 15);
$printtimescale;
tr.add_delay;
end
endmodule
-------------------------------------------------------------------------------
I save this code as file tb_top.sv, and run command: xrun tb_top.sv
Then, below info print:
Time scale of (tb_top) is 1ps / 1ps
Time scale of (worklib.$unit_0x35beeaed::trans) is 1ns / 10ps
0.000 ns: add_delay begin
2.120 ns: add_delay end
xmsim: *W,RNQUIE: Simulation is complete.
In my opinion, class trans should have timescale of 1ps/1ps, which is same to tb_top.sv. The first timescale(1ns/10ps) should not take effect.
I've tried Synopsys VCS, it print below info:
TimeScale of tb_top is 1 ps / 1 ps
TimeScale of $unit is 1 ps / 1 ps
0.000 ns: add_delay begin
0.002 ns: add_delay end
This is what I expected, I think VCS works well.
Does anyone know why xrun does not comply with SV spec?
Thanks!
↧
Regression with Vmanager
Hi,
I am new to using Vmanager and I have multiple vsif files for lunching the regression of multiple blocs.
But I would like to have an automatic regression launched every week for example with a combination of all the previous regressions I launched.
Is there any way to do that ?
Through a script maybe or a vsif file which would combine all the previous ones ? It would be great if I could have some examples too.
Thanks in advance.
↧
vManager Failing due to BDARGF and WKUNLK error codes
I can run a regression with the count variable equal to 1 or 2 for all tests, without failure. I.e. test test_name {count : 2;}; inside of a group (.vsif script). However when I attempt to increase this value to say 4 or 16 for example, I get those error codes (BDARGF and WKUNLK). There seems to be little to no documentation about what these mean. I have ascertained that it's related to being unable to obtain a lock on some resource, but what confuses me is that I am using the "-R" argument in the runs_dispatch_parameters section of the .vsif script. I was under the impression this would prevent recompilation and allow each test iteration to run in its own workspace?
There are a total of 54 tests in the current regression, so not hundreds or thousands.
I'm not sure what other information would be helpful.
↧
Indago waveform is not showing after Design reload
Hi,
I am facing the issue where indago waveform goes blank after I reload design. Below are the steps
1. I simulate and open the waveform in indago
2. find the RTL issue, fix it and re-run
3. reload the design after test is done.
After step 3, 70% time it is okay but 30% time it does not reload correctly and all the waveform window is blank. (though signal name is still visible)
If I close indago, (remove myDb and rerun the test it works fine.
What could be the issue?
Abhishek
↧
↧
Different result with vmanager and standalone simulation, with same seed
Hi,
I am running standalone simulations with xcelium, and I have siimulation passing. When I run it in regression, simulation fails due to errors in the checkers, that I have implemented. Checkers are simple, only checking voltage levels at point of time, or calculating slew.
When I use the same seed from regression and run it standalone, simulation passes. Results in SimVision, when, observed look ok.
Types of errors are for example too much difference between expected and measured voltages.
I did check vsif file several times, and I don't see any difference between vsif and standalone setup. Only difference is seed, but as I said, even with same seed, I get pass in standalone.
Sorry, if my terminology is off, hope you will understand the issue.
Did anyone, have this kind of issue, adn can you point me what to check, or where to look? Thank you.
Best regards,
Djordje
↧
error happen when using Debugging UVM with simvision
Recently I'm studing how to debug UVM code using simvision. I find a doc named "Debugging UVM" in cdnshelp utilty. In this doc, an example give below steps:
-----------------------------------------------------------------------------
For example:
> xrun -access rwc -linedebug -gui -uvm +incdir+../sv ubus_tb_top.sv -uvmtest sv:test_2m_4s
This example uses -access, -linedebug, and -gui to provide access to design objects and source line numbers, and to invoke SimVision at startup. The -uvm option enables UVM features. The +incdir+ option is used here to specify the directory in which the source files are located. When xrun looks for the top-level source file, ubus_tb_top.sv , it includes ../sv in its search path. The -uvmtest option specifies the top level of the hierarchy, test_2m_4s. The sv: prefix indicates that the top level is written in SystemVerilog.
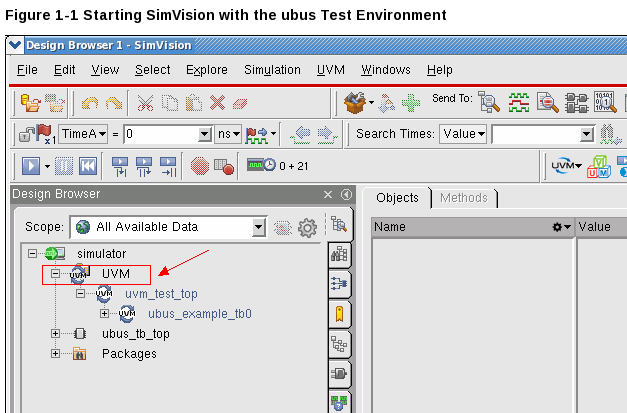
This command starts SimVision with its default window layout. That is, SimVision opens a Design Browser and a Console window, as shown in Figure 1-1. The Design Browser displays the design hierarchy, and the Console window lets you run the simulator and SimVision through their Tcl command interfaces. SimVision provides several built-in layouts, including a UVM debugging layout. It also lets you create your own layouts.
-----------------------------------------------------------------------------
But,after I use this command under uvm example directory, althrough SimVision window appears:
1. it's not same to Figure 1-1. In Design Browser, under "simulator", there is no "UVM" hierarchy; (Please refer attached picture)
2. when I click "run" button, this error happen and simulation stopped:
xmsim: *W,MLUVMDEPR: The ML-UVM legacy solution is being deprecated in Xcelium 2016.11 and will not be included in Xcelium 2017.04. The Cadence support team can provide documentation describing how to migrate from the legacy ML-UVM to UVM-ML.
xmsim: *F,MLUVM05: -uvmtest or -uvmtop argument 'test_2m_4s' has been specified in language 'sv', but no adapter for that language has been registered. Use the Cadence utility 'xmhelp xmsim MLUVM05' for more information.
Does anybody know why this happen? Thanks a lot!

↧
SA Register output issue
Hello,
I am implementing a 10-bit sar adc using cadence. I have been stuck in the SA Register part. I am using 22 numbers of D-Flipflops. The single flip-flop circuit is functioning absolutely fine and all the 11 flip flips on the upper row in the below screenshot I have attached, are acting absolutely fine when the Q of one flip flop is connected to the D of the next flip flop. I am getting Q low and Qbar high in each flip flop of the upper row. Now when I am connecting the below flipflops and completing the register circuit, I am not getting the desired bit output, Can anyone please help me?
I am attaching the screenshots of the schematic and output pattern below.


↧
how to get time range of each waveform file?
I use xrun to run a simulation and get a waveform directory -- "waveform.shm", which include a .dsn file and multiple .trn file. Each .trn wave file is 2GB size because I use "database -incsize 2G" to dump waveform. Now my question is, is there any way to get the time range of each .trn waveform file? For example:
0 ~ 1000ns waveform.trn
1000ns ~ 2500ns waveform-1.trn
2500ns ~ 4500ns waveform-2.trn
This info is very useful because when debug waveform I don't want to open whole .shm waveform, it's too big. I want to open only specific time waveform. But I can't find this information after simulation is completed.
↧
↧
HOW TO PLAY WAFFLE GAME?
Waffle Game: This is a classic game that’s been around for centuries. Players use a waffle as the basis for a playing field. They must cross the road alive to win. Anagram: This is a game where players use the letters of the alphabet to solve puzzles. Multilanguage Game: This type of game allows players to compete in languages other than English. Word Puzzle: Players must unscramble messages to win. Riddle: This type of game is often used to test.
↧
how to get time range of each waveform file?
I use xrun to run a simulation and get a waveform directory -- "waveform.shm", which include a .dsn file and multiple .trn file. Each .trn wave file is 2GB size because I use "database -incsize 2G" to dump waveform. Now my question is, is there any way to get the time range of each .trn waveform file? For example:
0 ~ 1000ns waveform.trn
1000ns ~ 2500ns waveform-1.trn
2500ns ~ 4500ns waveform-2.trn
This info is very useful because when debug waveform I don't want to open whole .shm waveform, it's too big. I want to open only specific time waveform. But I can't find this information after simulation is completed.
↧
"Direction" of EEnet connection points?
I am using EEnet in SystemVerilog models to get some analog behavior of the connections (ports?, pins?) of my models.
My question is about declaration of the "direction" of the ports, i.e. is there a difference in declaring an EEnet connection point as input, output or inout? If so, what is the difference? I am using ADE Explorer as simulator in a Virtuoso environment.
↧
Query on DPI_SIGNATURE_DIFF Warnings
Hi,
The message from the warning is not very clear. So, can any one add more details on this warning? this will be hlepful to fix these warnings
Warning! in file /grid/cva/p4_08/sudhag/package/agile_gcc9/sjsudhag_novainstal07250930/dvproject/myfolder/tools.lnx86/esl/modelcatalogs/releasecatalog/cadence.com/transactor/smart_memory/vdefault/rtl/cdn_sm_dpi_funcs.vh at line 176 [DPI_SIGNATURE_DIFF]
Signature of DPI function/task (sm_imp_rtl2sc_read_line) has different array range(s) than the previous DPI function/task (sm_imp_rtl2sc_read_line) at line (176), in file (/grid/cva/p4_08/sudhag/package/agile_gcc9/sjsudhag_novainstal07250930/dvproject/myfolder/tools.lnx86/esl/modelcatalogs/releasecatalog/cadence.com/transactor/smart_memory/vdefault/rtl/cdn_sm_dpi_funcs.vh).
The code at line 176 is:
import "DPI-C" context function void sm_imp_rtl2sc_read_line(int unsigned id,
int unsigned addr,
int unsigned blen,
bit [7:0] ch_id,
output bit [((1<<LINE_WIDTH)*(DATA_WIDTH))-1:0] data,
int unsigned trans_id);
↧
↧
Instance is unresolved in module
Hi,
I am using Altera Quartus 19.1 Standard Edition to generate a testbench system using qsys.
I am using the setup generated by it in to simulate using Xcelium.
Using shell script , I am getting few following error
xmelab: *E,CUVMUR (/home/videopath_tb/alt_vip_cl_cvo_191/sim/test_frame_videopath_alt_vip_cl_cvo_191_6d532fy.v,606|10): instance 'test_frame_videopath_tb.test_frame_videopath_inst.interlaced_cvo.cvo_core' of design unit 'alt_vip_cvo_core' is unresolved in 'test_frame_videopath_tb_alt_vip_cl_cvo_191.test_frame_videopath_alt_vip_cl_cvo_191_6d532fy:module'.
) video_out (
|
xmelab: *E,CUVMUR (/home/videopath_tb/alt_vip_cl_tpg_191/sim/test_frame_videopath_alt_vip_cl_tpg_191_na3yy5q.v,79|11): instance 'test_frame_videopath_tb.test_frame_videopath_inst.interlaced_tpg.video_out' of design unit 'alt_vip_video_output_bridge' is unresolved in 'test_frame_videopath_tb_alt_vip_cl_tpg_191.test_frame_videopath_alt_vip_cl_tpg_191_na3yy5q:module'.
) tpg_multi_scheduler_inst (
|
xmelab: *E,CUVMUR (/home/videopath_tb/alt_vip_tpg_multi_scheduler_191/sim/test_frame_videopath_alt_vip_tpg_multi_scheduler_191_esxktaq.sv,75|28): instance 'test_frame_videopath_tb.test_frame_videopath_inst.interlaced_tpg.scheduler.tpg_multi_scheduler_inst' of design unit 'alt_vip_tpg_multi_scheduler' is unresolved in 'test_frame_videopath_tb_alt_vip_tpg_multi_scheduler_191.test_frame_videopath_alt_vip_tpg_multi_scheduler_191_esxktaq:module'.
) core_0 (
|
xmelab: *E,CUVMUR (/home/videopath_tb/alt_vip_cl_tpg_191/sim/test_frame_videopath_alt_vip_cl_tpg_191_na3yy5q.v,138|8): instance 'test_frame_videopath_tb.test_frame_videopath_inst.interlaced_tpg.core_0' of design unit 'alt_vip_tpg_bars_alg_core' is unresolved in 'test_frame_videopath_tb_alt_vip_cl_tpg_191.test_frame_videopath_alt_vip_cl_tpg_191_na3yy5q:module'.
) mm_master (
Any help in finding solution will be appreciated.
↧
how to get time range of each waveform file?
I use xrun to run a simulation and get a waveform directory -- "waveform.shm", which include a .dsn file and multiple .trn file. Each .trn wave file is 2GB size because I use "database -incsize 2G" to dump waveform. Now my question is, is there any way to get the time range of each .trn waveform file? For example:
0 ~ 1000ns waveform.trn
1000ns ~ 2500ns waveform-1.trn
2500ns ~ 4500ns waveform-2.trn
This info is very useful because when debug waveform I don't want to open whole .shm waveform, it's too big. I want to open only specific time waveform. But I can't find this information after simulation is completed.
↧
"Direction" of EEnet connection points?
I am using EEnet in SystemVerilog models to get some analog behavior of the connections (ports?, pins?) of my models.
My question is about declaration of the "direction" of the ports, i.e. is there a difference in declaring an EEnet connection point as input, output or inout? If so, what is the difference? I am using ADE Explorer as simulator in a Virtuoso environment.
↧